
The information technology sector has an important cascading effect on the global economy. Generating revenue and employing workers at a relatively high median wage, the IT sector also helps other sectors “improve productivity, operate more efficiently and innovate faster,” per CompTIA.
Not to mention that information technology can be a driving force in markets and can create transformative business value across a wide range of industries and markets.
Consider the industry’s potential with this roundup of IT market statistics and trends.
Every job at a computer system design firm helps to directly and indirectly support five other jobs in the economy. — CompTIA
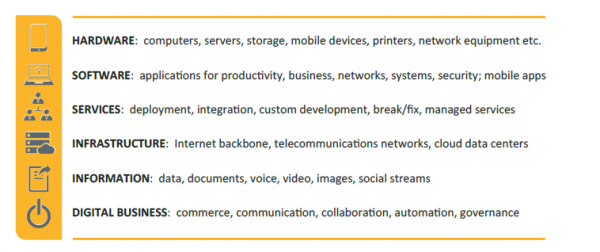 Source: CompTIA
Related reading: Defining a value proposition for IT service companies
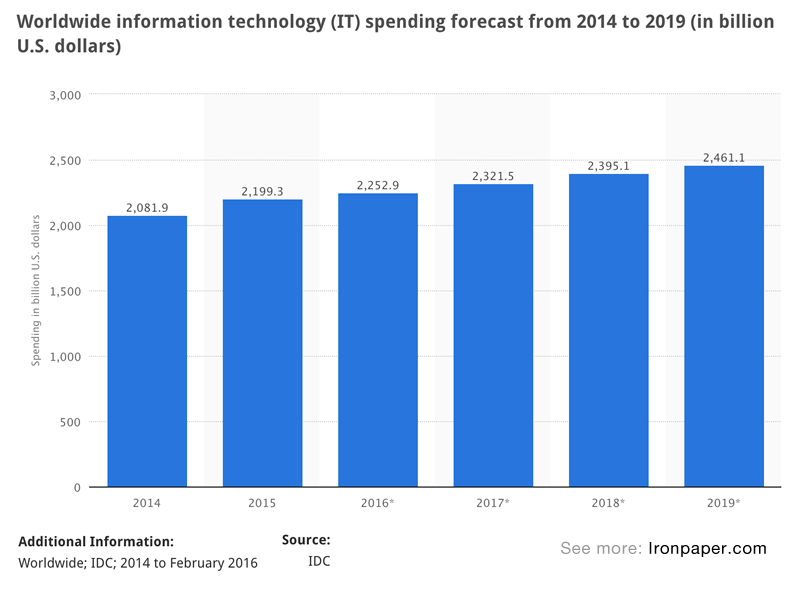
Spending on worldwide information technology continues to grow. The market rose from US $2,081.9 billion in 2014 to $2,199.3 billion in 2015. The IDC predicts the market will reach $2.252,9 billion this year and $2,461.1 billion by 2019.
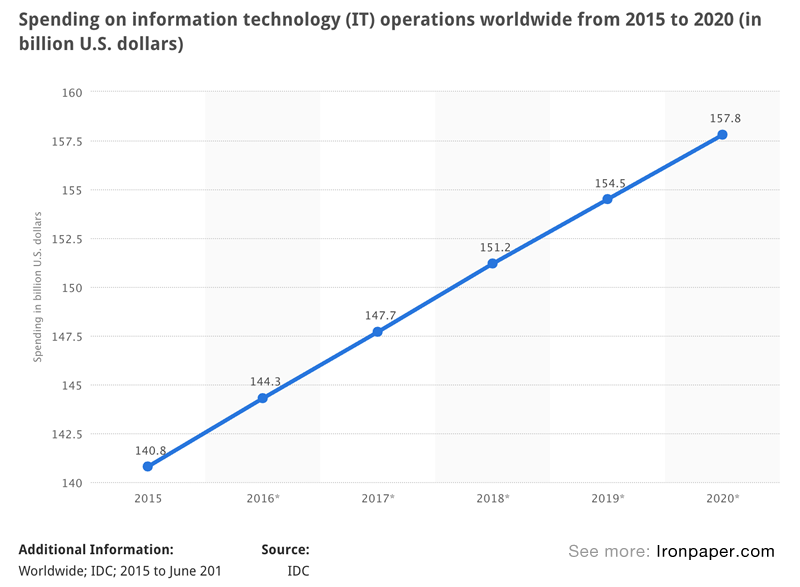
Below is a graphic depicting the projected increase in IT operations spending globally from 2014 to 2020. The report from IDC projects an increase from 140.8B in 2015 to 157.8B by 2020 globally.
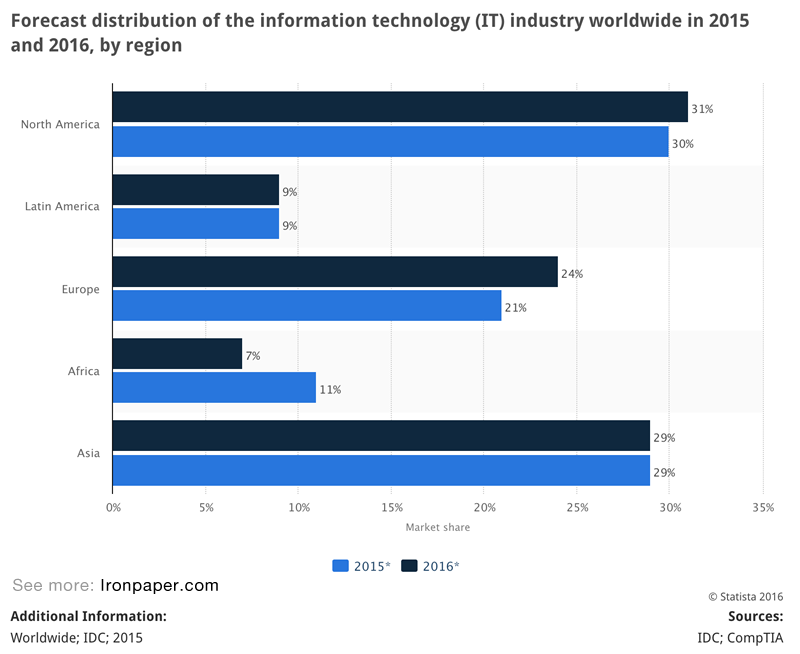
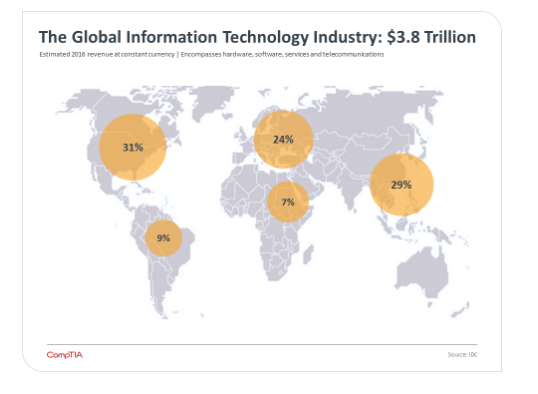
IDC and CompTIA forecast North America will be the source of 31% of the global IT industry's revenues. That's worth $3.8 trillion U.S. dollars worldwide. Yet Asia is not far behind at 29%. In fact, China is fueling the biggest shift in global industry allocations, IDC noted.
At the same time, the actual growth rate is expected to slow from a 5.64% rate in 2015 to 2.44% this year and ultimately 2.75% in 2019. Weaker growth reflects a declining PC market and slowing sales of servers and storage. Also, China is suffering from market saturation for smartphone technology, said IDC Customer Insights and Analysis VP Stephen Minton.
Overall, the hardware segment is forecast to account for the largest share of global IT spending.
 Source: IDC
Yet, within the regions, the allocation of spending tends to vary. CompTIA notes, “some markets may be relatively immature in the traditional categories of computers and software, and yet relatively advanced in the areas of mobility and wireless communication.”
 Still, in examining demand for IT products among global small and medium-sized businesses (SMBs), IDC sees a roughly 2% growth rate.
"Increasing investment in technology is an appealing way for firms to expand their capabilities without necessarily increasing their headcount,” noted IDC Raymond Boggs, VP of SMB research. “Technology spending will continue to vary by company size, geography, and IT category, with solutions-oriented spending (especially related to cloud and mobility) showing the greatest growth."
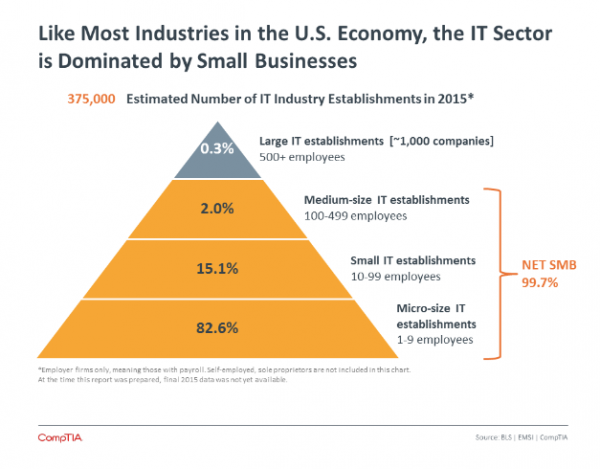
In the US, the IT industry is dominated by small businesses. Of the 375,000 estimated IT industry establishments in 2015, 97.7% had fewer than 100 employees.
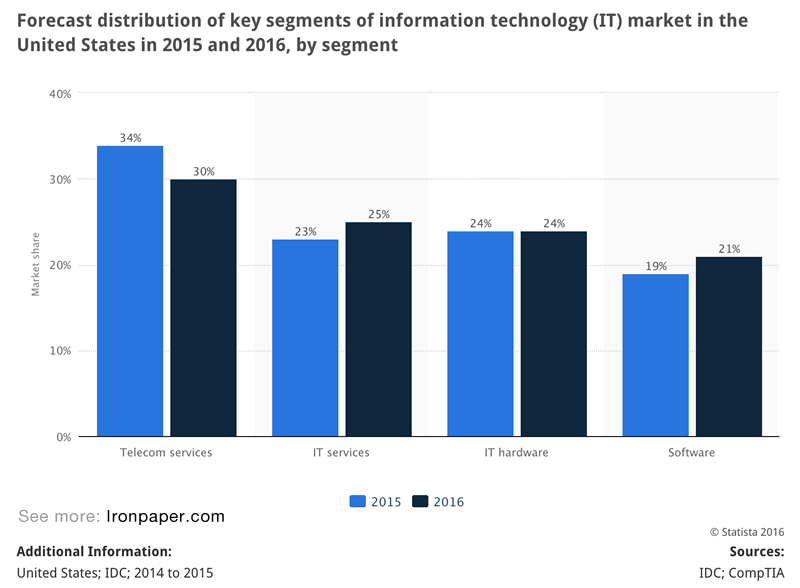
Within the U.S., telecom services are expected to represent 30% of the country’s IT market. Compare this to the 41% forecast for telecom service spending in the global IT market.
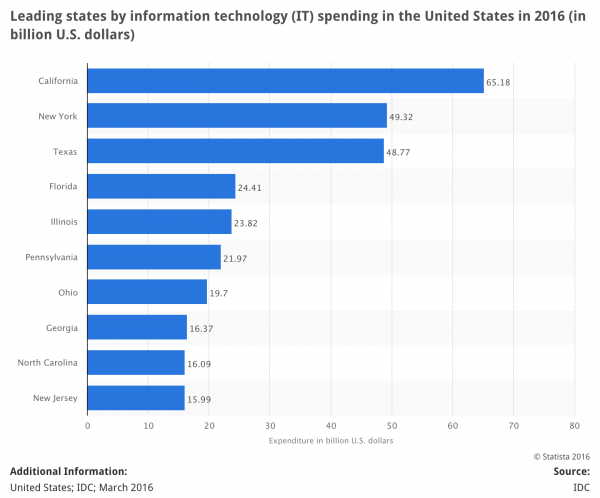
IT spending is at its highest in California, with New York and Texas nearly tied at second and third. Ohio, Georgia, and North Carolina also appear in the top 10.
Federal government IT spending in the U.S. is also on the rise. Having come in at $73 to $76 billion US in 2011 through 2014, the spending topped $80 billion in 2015. For the 2017 fiscal year, the government has budgeted 81.6 billion U.S. dollars for IT spending.
With these IT market statistics and trends in mind, what decisions will your marketing team make? Let Ironpaper help.
Related reading: Inbound Marketing Tips for IT Service Companies
IT Market Statistics Sources:
Boggs, R. (2015, July). Worldwide Small and Medium-Sized Business Forecast, 2015–2019: IT Spending by Company Size and Region for Key Hardware, Software, and Services Categories. https://www.idc.com/getdoc.jsp?containerId=257280
CompTIA. (2016, January). IT Industry Outlook 2016. https://www.comptia.org/resources/it-industry-outlook-2016-final
Statista. (2016). statista.com
Steele, A. (2016. Feb. 17). Global IT Spending Expected to Slow, IDC Says. https://www.wsj.com/articles/global-it-spending-expected-to-slow-idc-says-1455719845
IDC, Source link idc.com, Release date September 2016
by Jonathan Franchell, CEO of Ironpaper - For more tips and hacks: Need to remove a new line after h1 tags? Both web designers and SEO practitioners need to employ headline tags: H1, H2, H3 in several ways to improve web page structure and tag...

The Crowded Arena of the IT Marketplace Updated December 2024 The Information Technology (IT) landscape is experiencing rapid growth and intensifying competition. IT spending is projected to reach nearly 5.1 trillion U.S. dollars in 2024, a...

Updated December, 2024 The field of digital marketing is evolving rapidly in response to new technology and changing buyer expectations. To help career-minded marketers, we’ve rounded up the top 10 skills needed to succeed in the field. These are...
