
“Did you watch ___?” has long been a conversation starter in the office break room or at a cocktail party. Americans today have even more options with which to fill in that blank, though. Media is increasingly fragmented in today's market.
Adults in the US receive an average of 206 television channels yet watch only 20, per Nielsen. Consider these TV and Video on Demand statistics and trends when looking to understand the shifts in our viewing habits.
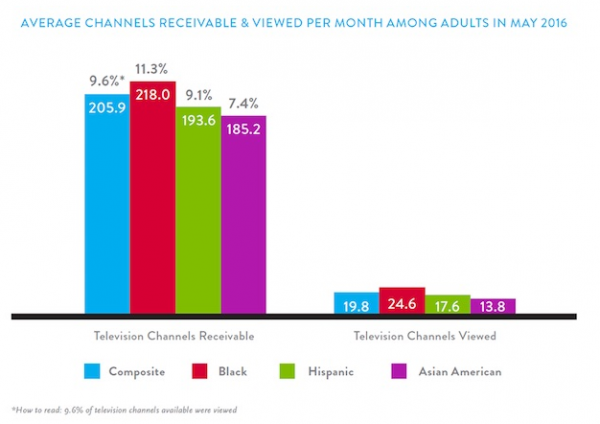
TV remains the most used medium in the United States:
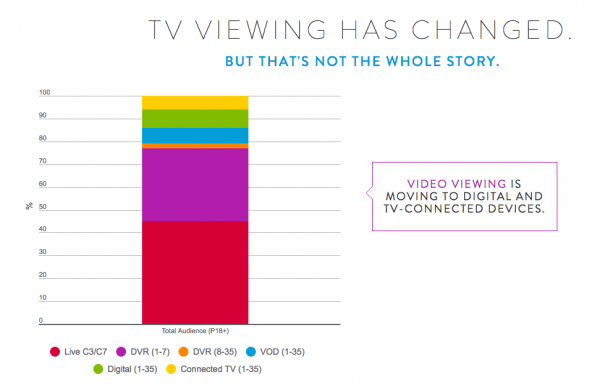
Yet, the way we view television is changing, according to Nielsen, especially how we engage with the content we want to watch.
The Video on Demand (VOD) market includes pay-per-view (PPV), video downloads, and streaming media. This premium content is shared over the Internet, typically on a pay-per-view, subscription, or download purchase price revenue model.
The global VOD market is about US$16.3 billion in 2016. Accounting for 16% of the digital media market, VOD is significantly larger than digital music and on a similar level to ePublishing.
 The VOD market cumulatively amounted to US$9,529 million in 2016, with growth in PPV, video streaming, and video downloads predicted to drop annually.
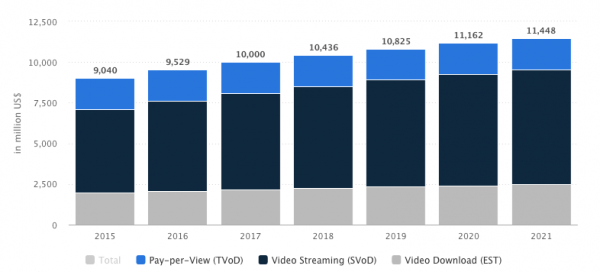
The video market globally is growing at a compound annual growth rate of 8.3% to 2021. Still, saturation effects are starting to show in the US. Its CAGR is forecast at only 3.7% by 2021.
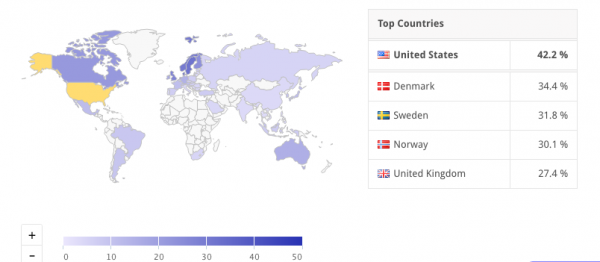
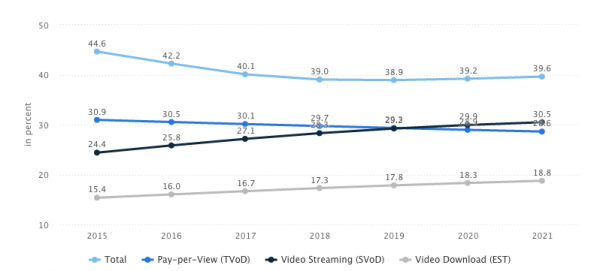
User penetration in the VOD segment is 42.2%, down from 44.6% in 2015. This rate, too, is predicted to drop, with VOD user penetration leveling out just below 40% between 2018 and 2021.
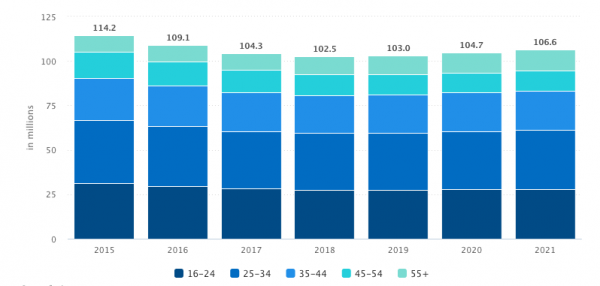
Unsurprisingly, the majority of 2016 users are under the age of 34. There are 29.6 million users aged 16 to 24 and 33.9 million in the 25 to 34 age group.
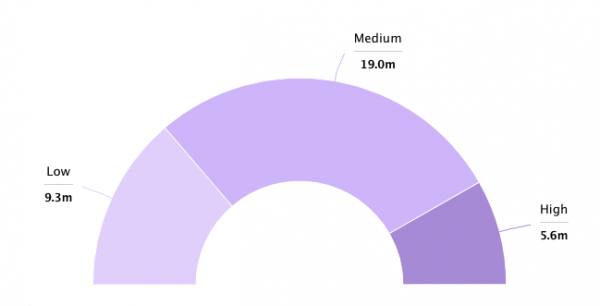
 In that same 25 to 34 population, viewers can be segmented into different income levels, with middle-income users making up nearly 50% of the audience in this age group.
Netflix users spent 10 billion hours per month watching Netflix for a total of 42.5 billion streaming hours in 2015, according to Goldman Sachs
Plus, according to Deloitte, 70% of Netflix users binge-watch shows. Among millennials, 35% did it weekly.
Hulu has streamed 700 million hours, even though it only has 9 million subscribers compared to Netflix’s 81 million.
Amazon Prime, too, is gaining more traction, with 54 million members at the end of 2015, a 35% jump from the previous year — although this doesn’t say how many of those members are active Amazon Prime streaming content viewers.
Meanwhile, YouTube has over a billion users, and 80% of its views are from outside the U.S.
Our viewing practices are changing. Marketers need to remain abreast of the movement in this market to have the best chances of marrying campaigns to the correct context for the right audience. Additionally, media companies can harness digital trends to capture and convert new audiences. Digital transformation is ripe within the media and video industries.
Video on Demand Statistics Sources:
by Jonathan Franchell, CEO of Ironpaper - For more tips and hacks: Need to remove a new line after h1 tags? Both web designers and SEO practitioners need to employ headline tags: H1, H2, H3 in several ways to improve web page structure and tag...

The Crowded Arena of the IT Marketplace Updated December 2024 The Information Technology (IT) landscape is experiencing rapid growth and intensifying competition. IT spending is projected to reach nearly 5.1 trillion U.S. dollars in 2024, a...

Updated December, 2024 The field of digital marketing is evolving rapidly in response to new technology and changing buyer expectations. To help career-minded marketers, we’ve rounded up the top 10 skills needed to succeed in the field. These are...
